JSL EDUCATION AND HIGHER STUDIES
LThe Somaliland Education Sector Strategic Plan (2017-20121) is a detailed planning document that provides a comprehensive outlook of the roadmap that the Somaliland Education Sector will take over the next five years. The ESSP borrows heavily from an evidence-based Education Sector Analysis (ESA) 2012-2016, looking back at the goals and strategies set in the Education Sector Strategic Plan of 2012- 2016 and the achievements, failures and lessons learned. More importantly, the ESA provides a basis and relevant analytical information for the development of a robust, credible and realistic ESSP (2017-2021).
The global progression from the Millennium Development Goals (MDGs) to Sustainable Development Goals (SDGs) necessitates that countries and governments develop credible, reliable yet sustainable strategies and plans that seek to align key sectorial activities to broader SDG goals. Somaliland is no exception. These broader goals and objectives are aligned with the principles of Convention of the Rights of the Child (CRC) that looks at education as a right which plays an important role in the empowerment to democratic action, social rights and equipping of important lifelong skills. If well implemented the plan will progressively lead the sector and the country at large towards the achievements of the Sustainable Development Goals (SDGs) and in particular the 4th goal of ensuring inclusive and quality education for all and promote lifelong learning, the 5th goal to achieve gender equality and empower all women and girls, the 10th goal to reduce equalities within and among countries and the 16th goal to promote just, peaceful and inclusive societies. On a medium to long term basis, sustained identification of key strategic priorities within the education sector followed through by targeted investment especially in the TVET sector by donors will lead the country closer to the achievement of SDG Goal 1 (elimination of extreme poverty) and SDG Goal 8 (inclusive and sustainable economic growth through employment and decent work for all).
Whereas challenges to the full achievement of some of these goals do exist, the Somaliland Government, the Ministry of Education, the education donors and implementing partners are committed to working together to make sufficient progress in the achievement of these indicators.
This plan is the second ESSP for Somaliland. Some efforts have been made to highlight key projections throughout the sector where feasible and relevant, although it should be noted that availability of credible and reliable data continues to be a critical challenge to an accurate appraisal of the progress made in the sector over the past five years. The Education Management Information System (EMIS) provides most of the data that has gone into strengthening arguments and assertions made in these analyses covers only some subsectors leaving vital data gaps that should be addressed going forward.
Furthermore, the strategy goes beyond a mere statement of objectives and activities of the education subsectors of Early Childhood Education (ECE), Primary/ABE, Secondary, Non-Formal Education, TVET and Higher Education but takes into consideration the linkages with the cross-cutting themes and the roles played in enhancing the quality, access and effectiveness of the education and training systems.
The plan further builds on the key findings and recommendations from the ESA Somaliland Education Sector Analysis (2012-2016) and seeks to solidify the recommendations into key strategies broken down into measurable activities and results on key indicators for the sector.
The themes of Education Financing, Governance, Curriculum Development, Quality Assurance, Out of School Children, Internal and External Efficiency, Gender and Equity have been given prominence in the plan, and in their role in sustaining the main sub- sectors and their contribution to providing quality education and training services.
In the realization of the increasingly outstanding importance being accorded to matters related to risk and fragility, the ESSP has delved into useful insights and strategies that contribute to the capacity to predict and respond to emergencies, building resilience and peacebuilding limited data notwithstanding.
HE Abdillahi Ibrahim Habane, Minister for Education and Higher Studies, Republic of Somaliland
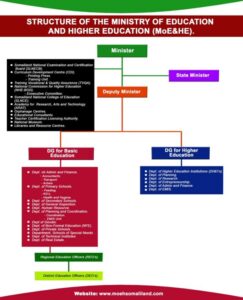
The Somaliland MOEHS Organizational Structure
.Vision
“Somaliland envisions education as means to prepare all learners to become life-long learners equipped with the skills, knowledge and attitudes to be successfully productive citizens” (Somaliland National Policy of Education, 2015-2030).
This supports the Government of Somaliland’s Vision 2030, which states that Somaliland will be “A nation whose citizens enjoy equitable and quality education.” (Somaliland National Development Goals). The Vision provides a roadmap to ensure that no-one is left behind in national development, through its intent on affirmative action. Vision 2030 inspires Somalilanders to focus on commonly owned goals concerning and shared values and principles around which they can rally to build a prosperous nation.
Mission
“The mission of National Education of Somaliland is to provide a quality and relevant education that will prepare every student to be success in life with partnership of its parents and communities” (Somaliland National Policy of Education, 2015-2030).
Somaliland National Education Goals
|
National Education Objectives
|
|
The Republic of Somaliland has invested a great deal to develop its country. A knowledge economy based on investment in human capital continues to be a priority for the Ministry and the government more broadly. Although great accomplishments have been achieved in the Education sector many challenges still remain. Some of the challenges faced by the education sector and for children’s learning are specified in the Somaliland National Development Goals, and the full Education Sector Analysis completed as part Policy Context
This chapter provides the context for the Somaliland ESSP (2017-2021) looking at macroeconomic conditions, demographics, risks and hazards facing the education sector and learners including issues of ‘fragility’, and cost and financing of the education sector in Somaliland. The policy context is described in this section taking into account the relevant national policy documents.
2.1 Economic and Social Context
Economy. Reliable and recent macroeconomic data about Somaliland is largely unavailable3. Nevertheless, there exist estimates based on statistical projections of Somalia including Somaliland-wide GDP. For instance, the World Bank’s socio- economic survey of 2002 gives the figure US$ 1.6 billion, while its 2006 survey estimated GDP at US$ 1.3 billion. Most of the international institutions use these sources, whilst the latest CIA Fact Book figures Somalia GDP in Purchasing Parity Price (PPP) prices is given as US$ 5.89 billion, and the per capita income at US$ 600. The nominal GDP at the official exchange rate is estimated at US$ 2.37 billion, which implies a GDP per capita of about US$ 400. The Somaliland Ministry of National Planning and Development estimates that Somaliland has an average GDP of US$ 1.05 billion in nominal prices. Table 3 summarizes economic statistics for the region with the majority of people (71%) working in the agriculture sector. The largest sectors contributing to GDP are agriculture (including livestock) followed by services and remittances (see full ESA 2017 for details).
Table 3. Economic Statistics for Somaliland
- Republic of Somaliland Ministry of National Planning and 2012. National Development Plan (2012-2016)
| GDP – Composition by Sector of Origin: | ||
| Agriculture: | 60.2% | |
| Industry: | 7.4% | |
| Services: | 32.5% (2013 est.) | |
| Agriculture – Products: | Bananas, sorghum, corn, coconuts, rice, sugarcane, mangoes, sesame seeds, beans; cattle, sheep, goats; fish | |
| Industries: | light industries, including sugar refining, textiles, wireless communication | |
| Industrial Production Growth Rate: | 2.5% (2013 est.) | |
| Labour Force: | 3.109 million (2013 est.) | 88 |
Deprivation Index.
The Multidimensional Poverty Index (MPI) captures the incidence of poverty and the intensity of deprivation within a population (the proportion of poverty indicators by which an individual is 100% deprived). Whilst the incidence of poverty in Somaliland is 72%, the average intensity of poverty is 54%. Poor living standards contribute more than 50% of average deprivation, reflecting weak service infrastructure (for example, roads, sanitation and housing), which have a profound effect on poverty. Education is the second-highest contributor at 33%.
Economic and Livelihood Challenges.
The population in the age group 15 to 64 that is working or is available for work is considered to be the economically active population. In Somaliland, this constitutes 56.4% of the total population, a total of 1.9 million people. Total employment (comprising self-employment, paid employment, unpaid economically productive family work excluding normal household chores) is 29.62% of the total population (or 52.6% of the economically active population) meaning that half of the labour force is not engaged in any form of productive employment i.e. is not economically active and has no employment status.
Of prime concern is youth unemployment, as two-thirds of the youth are unemployed
– one of the highest rates in the world. This is among the factors fuelling the appeal of extremist groups such as Al-Shabaab, who in the past actively recruited their members from the youth across the horn of Africa region4. Furthermore, this has led to major vulnerability of young people aggravating their exposure to risks and other forms of exploitation that trap them in cycles of poverty and underdevelopment.
As the Figure below shows, the estimated labour force is slightly higher in rural compared to urban areas, but conversely there are fewer people employed in rural areas compared to urban areas. Education and training services have been known to provide one of the most effective interventions to that can address unemployment through imparting of knowledge and skills that lead to employment or self-employment.
Figure 1. Disaggregation of employment by Gender and Rural-urban Classifications
Somalia Human Development Report 2012.
Child Labour and early marriage.
A 2004 survey estimated that child labour in Somaliland is 18% of total number of children aged under 18 years. Of these working children, the sector distribution is summarized below. Whilst the reasons for child labour are not discussed in the survey, factors such as poverty, social exclusion, labour mobility, discrimination and lack of adequate social protection as well as lack of educational opportunity are contributors and influencers of child labour7. Further, the number of working children may constitute a significant proportion of out-of-school children in the country, and can contribute to explaining the primary and secondary school enrolment rates.
In regard to early child marriage, it is apparent (and generally well documented) that low education levels especially among women quite invariably leads to early marriage and poor pregnancy and child care practices leading to such high mortality rates (ESA 2016). The assessment, poverty is also a motivation for early marriage of girls, who show on average a higher dropout rate than boys in Primary school.2.2 Demographic and social welfare indicators
Table 4. Population distribution by Age and Region (PESS, 2014)
Region Male Female Total
Number Percentage Number Percentage
Awdal 348,479 51.8 324,784 48.2 673,263
M/jeex + Sahil 618,827 49.8 623,176 50.2 1,242,003
Togdheer 361,315 50.1 360,048 49.9 721,363
Sool 173,026 52.8 154,402 47.2 327,428
Sanaag 283,035 52 261,088 48 544,123
TOTAL 1,784,682 51.3 1,723,498 48.7 3,508,180
UNFPA Somalia/Somaliland Population Estimate Survey 2014
The total estimated population of Somaliland is some 3.5 million people. The average population growth rate is 3.1% per annum8. 51.3% of the population is male, whilst 48.7% is female9 . Sixty-two percent of the female population is aged under 25, compared to 66% of males. The average life expectancy is 50 years and 55 years for males and females, respectively10. The total population is expected to grow by 32% between 2010 and 2020, whilst the under 15 years’ old age group will decrease slightly from 44.4% to 44.2%, signifying a greater number of children of school age11. This implies that the capacity of the education system will not only need to grow at a similar rate i.e. by 32% over 10 years to accommodate increasing population numbers of school-aged children and adolescents.
Rural-Urban Migration. There are nearly 1.85 million people living in urban areas
(52.9%), compared with about 0.4 million in rural areas and 1.2 million nomadic/pastoralist (combined 44.8%) and 84 thousand internally displaced persons (IDPs) (only 2.4%). Over past years the proportion of the population living in urban areas has increased over those living in rural areas.
Region Urban Rural Pastoralist IDPs Total
Awdal 287,821 42.8% 143,743 21.4% 233,709 34.7% 7,990 1.2% 673,263
Maroodi- Jeex and Sahil
802,740
64.6%
138,912
11.2%
255,761
20.6%
44,590
3.6%
1,242,003
Sanaag 159,717 29.4% 30,804 5.7% 352,692 64.8% 910 0.2% 544,123
Sool 120,993 37.0% 13,983 4.3% 187,632 57.3% 4,820 1.5% 327,428
Togdheer 483,724 67.1% 57,356 8.0% 154,523 21.4% 25,760 3.6% 721,363
Total 1,854,99
5
52.9%
384,798
11.0%
1,184,317
33.8%
84,070
2.4%
3,508,180
UNFPA Somalia/Somaliland Population Estimate Survey 2014
2.3 Overview of the Achievements and Key Challenges of the ESSP 2012-16
Between 2012 and 2016 the allocation of national funding to the education sector has increased in nominal terms with increases in the national budge, although there has been limited progress regarding increasing allocations to the education sector as a proportion of the national budget.
Over the past five years the budget allocation to education has almost doubled from US$ 7.8 million in 2012 to US$ 14.6 million by 2016. Up to 72% of this budget allocation13 was absorbed by teachers’ salaries, which, despite reported as being low14, has left little for capital expenditure and other running and recurrent costs, especially for free primary education that was introduced in 2011.
For the Primary subsector there is a 9.9 % increase in the number of primary schools from the baseline number of 987 schools in 2012, which is a growth rate of approximately 2% annually. At the same time, the number of ABE centres has declined. The average annual growth rate of classrooms is 15.9% in the formal primary sector for the last five years, which is below the 612 classrooms annually promised in the ESSP 2012/16 but sufficient to keep up with the growing enrolment at this level.
In the secondary education subsector, the total current student enrolment of both private and public schools as per the 2014/15 data is 47,913 compared to an enrolment of 31,072 in 2011 which translates into an increase of 54% over four years. This remains a very rapid increase in enrolment and thus a challenge to planners grappling with ensuring that as many learners as possible have an opportunity at education against a backdrop of limited resources. The total teaching force currently serving in the secondary education sector is 1,804 teachers of whom only 26 are female,
representing less than 2% of the work force. Overall growth compares with 1,112 teachers in 2011, which represents an increase of 62%.
Additionally, about 26% boys and 22% girls have attended formal school. Only a quarter of women in Somaliland are literate, and illiteracy status varies greatly across Somaliland. For example, 45% of women residing in urban areas are literate compared to only 10% of their rural counterparts (PESS 2014, UNFPA of Population, 2016).
The key successes of the ESSP 2012-16 are summarised as follows:
• A policy of free primary education has been implemented across the country (though yet to be realized for many children);
• 66% of primary teachers are now on the payroll of the government;
• An increase in the teaching force and slight growth of learners has meant the teacher-to-learner ratio has been maintained. The pupil-teacher ratio for formal primary was 31:1 in 2014/15;
• A school construction programme of classrooms has kept pace with the expansion in learner numbers;
• The introduction of a new outcome-based curriculum framework with syllabi (but as yet insufficient support learning materials produced based on the framework); and
• The Gender Parity Index for primary education has improved over the last four years from 0.76 to 0.83.
• Encouraging results in Somali literacy. There is also some improvement in
examination pass rates at grade 8 and form 4 b)
Key shortfalls in delivery of the 2012-16 ESSP are as follows:
• 5 % growth rate in GER in primary education against a target of 75%. A decline in the quality of teachers represented by an increase in the ratio of unqualified teachers, with nearly 50% of teachers not categorized as ‘qualified’;
• Low learning outcomes at primary level, with low results in mathematics and writing, but;
• Students’ participation rates in the education system are still low, with more than 50% of children and youth being excluded from basic education.
• Low proportion of female teachers reflecting ongoing gender-based inequities.
• Lack of effective government capacities to support EiE including for IDPs and pastoralist children.
• Ongoing challenges with capacity of the ministry to provide effective and efficient education services
• Stagnation regarding increasing budget allocations to the education sector as a proportion of the national budget.
• Quality in all subsectors is a constant challenge as evidenced by rather low achievement levels; and
• There is a significant trend towards increasing privatization of basic (primary and secondary) education, largely driven by the low-quality delivery of public
services, mostly attributable to the low quality of teachers and low professional morale, as well as poor infrastructure and lack of equipment in public schools.
2.4 Risks and Hazards to Education
Emergencies (e.g. drought, flooding, cyclone, financial shocks, conflicts, etc.) have had a profound impact upon children’s education during the timeframe of the outgoing ESSP with close to 35,000 children15 in Somaliland being forced out of school for different periods of time, and hundreds of schools either closed or damaged. Ordinarily, those most affected have been pastoral and rural communities where government and private sector services remain weakest.
Other risks related to governance, include a grossly underfunded sector, weak financial accountability and transparency, weak staff management systems, the lack of a policy framework for education in emergency or school safety and formal education systems that are not flexible enough to fit into the life style of the pastoralist communities (see full ESA report for further details on governance risks). All of these factors have had a profound effect on the delivery of quality and equitable education services over the last four years.
Other contributors to the fragility of the society and by extension education include the politicization of clan identities leading to mobilization of groups and communal conflict, the inability to provide security in contested areas and an increase in non-state actors exercising control at local level. In addition there has been migration of IDPs to urban centres, limited accountability and impunity for anti-social actions, a proliferation of small weapons, excessive use of khat leading to use of violence to resolve disputes and financing of crime. There have also been examples of violence against children in schools and the marginalization of youth from civic and political processes undermining the effective delivery of education and training services 16 . A nexus between these (and other) risks and how they impact on education is presented in the full ESA report.
Vulnerable groups in Somaliland. In the context of Somaliland, it is assumed by local stakeholders that specific groups are the most vulnerable to being impacted by
‘shocks’ or emergencies. Not surprisingly, those who are perceived as being most impacted are those who experience the greatest inequities in education, those identified as most vulnerable include pastoralist/nomadic communities, children in rural schools, as well as IDP communities. While ‘girls’ are seen as ‘most impacted’ by only 36.7% of respondents they are in fact the most affected overall when considering that girls make up roughly half of all children in rural and nomadic/pastoral communities.
Other groups cited as being impacted include orphans, those with disabilities, and returnees from Ethiopia who sometimes migrate back and forth between Somaliland
and the Somali Region of Ethiopia. Those who are least impacted are children from urban schools and, to a lesser extent, children from urban poor families. Common to those groups who experience the greatest impacts is that they are either from rural areas or nomadic/pastoralist communities and thus have limited access to social services, or experience high levels of inequity with how social services (including education resources) are allocated between urban and rural areas. Others who are most impacted also tend to be those who are most marginalized and ‘disempowered’, including girls and IDPs. Commonly underpinning these patterns are high levels of inequity or social and political marginalization experienced in different forms by the most vulnerable groups.
Table 6. Groups most affected by emergency/risks
Most impacted Sometimes (not much) Least
(hardly ever) Total (n)
Pastoralists 50 10 60
83.3% 16.7% 0.0%
IDPs 31 29 60
51.7% 48.3% 0.0%
Children from urban poor families 25 21 14 60
41.7% 35.0% 23.3%
Girls 22 29 9 60
36.7% 48.3% 15.0%
Children in urban schools 4 17 39 60
6.7% 28.3% 65.0%
Children in rural schools 38 18 4 60
63.3% 30.0% 6.7%
(Orphans x2, disabilities x4 Returnees x1) 7 7
0.0% 100.0% 0.0%
Risk and Hazard Survey, ESA Validation Workshop, Hargeisa, 2016 (Table developed using a sample of 50 schools in six regions and analysed by the technical officers of the MOEHS using excel calculations.)
Projections on School Age Population (6-13 years & 14-17 years). The UNDP Census of 2007/2009 estimated that the population was growing at the rate of 3% every year. It also estimated the number of six-year-olds, (the age when children should be joining Grade 1 of Primary School), at 49,47318 as of 2016/2017 fiscal year rising to 55,682 as of 2020/2021 fiscal year. The size of the population that will require Primary School education (6-13 years) is projected to rise from 572,986 in 2016/2017 to 644,901 in 2020/2021 while those that will require secondary school education will rise to about 269,167.
These projections however remain rough approximations, partly because they still use the baseline figure of 2007 and partly because they come with the assumption that no child between the age of 14 and 17 will be seeking primary school education. Additionally, the projections assume that secondary school learners are all below the age of 18. In both cases, the assumptions are highly improbable yet they remain our best for projections. Learners in Somaliland have been known to enrol into formal education much later and frequently take time out due to fees or family demands so that many Secondary learners are in fact over 20 and many primary school entrants 7 or over, especially in rural areas. For this reason, GER may be a better indicator of progress on many fronts over the next four years than the NER.
Figure 2. Projections on School-age Population (6-13 yrs.& 14-17 yrs)
Based on UNFPA 2014
2.5 Projected Trends on Key Indicators for Basic Education
Gross Enrolment Ratios and Net Enrolment Ratios. Gross Enrolment Ratio (GER)
is the total enrolment in a specific level of education, regardless of age, expressed as a percentage of the eligible official school-age population corresponding to the same level of education in a given school year.19 This rate is predicted to rise from 44.4% (or 48.8% based on weighted PESS data20) in 2014/2015 to 67% in 2020/2021 based on current trends.
Table 7. Weighted GER and NER for Primary
M F Total
GER 53.4% 44.2% 48.8%
NER 40.4% 34.5% 37.4%
Somaliland 2014/15, UNFPA PESS
Table 8. Non-weighted GER and NER for Primary Somaliland EMIS Statistical Yearbook, 2015-2016
Net Enrolment Ratio in primary education on the other hand is the number of pupils of official primary school age who are enrolled in primary education as a percentage of the total children of the official school age population. Based on current trends it is hoped that Somaliland will achieve 54% NER by 2021 – up from the current 33.7% (or 37.4% weighted based on PESS data).
For both GER and NER girls remain far behind boys in terms of access education with a roughly 10% difference with GER and approximately 5% difference for NER.
Gross Intake and Net Intake Ratios
Gross Intake Ratio (GIR), defined in the first grade of primary education as the number of new entrants in the first grade regardless of age, expressed as a percentage of the population of the official primary entrance age. To ensure that as many learners as possible get a chance at an education, it is necessary to expand opportunities for first grade learners as fast as the system can allow.
Considering the huge number of out of school children, targeted effort will need to be made to admit learners over the official Grade 1 entry age of 6 years. Therefore the GIR is projected to rise from 101.2% in 2016 to 115% in 2021. The fact that this figure is over 100% is an indication of the large number of overaged children who enter Grade 1.
Net Intake Ratio (NIR), being the new Grade 1 entrants who are the official primary school entrance age, expressed as a percentage of the population of the same age is projected to rise from 23.5% in 2015 to 34.5% in 2021 subject to aggressive investments in the sector and innovative efforts of increasing system efficiency
Projections on School Age Population and Out of School Children. To achieve universal education and eliminate illiteracy, the Government will strive to ensure that fewer school-age children are out of school.
Figure 3. Total School-Age Population and Out-of-School Children
Projections calculated based on the figures from UNFPA PESS 2014
By 2021, only two thirds of the school-age population will have been enrolled in formal education leaving about 33% of children out-of-school.
- Primary Education
5.1 Situation Analysis
Only 31.5% of Available data from the full ESA shows that school access and school retention remain critical issue at all levels of the education system, especially for the most vulnerable populations such as girls, rural/nomadic pastoralist, the poor, disabled, IDPs, and over-aged out-of-school children. However, when considering the drive to expand access rapidly by increasing numbers of schools and classrooms, one must also consider how to maintain the quality of education services.
Currently, in Somaliland, creating and meeting the demand for access to quality education remains a challenge. Only 36.8% have access to upper primary education (as shown further below) – let alone go on to complete secondary and post-secondary studies. For the country to meet its long-term development needs, it must develop its human resources to their full potential. Primary Education is the largest sector within the MOEHS structure. The enrolment numbers are the higher than in any other subsector. Thanks to the introduction of free primary education by Presidential Decree in 2011 there was a significant increase in enrolment, especially in Grade 1, though not as great as one might have expected when looking at the impact of free primary education in neighbouring countries. This increase, combined with poor management and supervision of teachers, lack of physical infrastructure, particularly in remote areas, inadequate teaching and learning materials, and low participation of school committees and communities in school management contribute to problems in providing quality education. And although Grade 1 enrolment increased, the overall increase in enrolment has been little more than the increase in the population in that age group. Thus, the enrolment figures have fallen well short of the targets put forward under the outgoing ESSP. The net effect has been a stagnant GER when compared with 2012.
Possible explanations for the causes for the MOEHS’s failure to meet the enrolment targets include:
- Lack of parental confidence in government schools providing relevant The large increase in private schools of higher quality is evidence of this lack of trust. They are of course, out of reach of most parents;
- The hidden costs of education, including clothing, exercise books and the opportunity costs of losing potential labour;
- The quality of the teachers, many of whom are demotivated due to low and irregular salaries exacerbated by the community no longer contributing through school fees;
- Lack of facilities in government schools, including lack of learning materials and physical facilities such as water;
- Difficulty of access because there are insufficient schools or schools are too far away, especially in rural
Gross Enrolment Ratio: A total of 239,454 children were reported to be in primary schools based on the latest available data in the 2014/2015 period. The primary education GER remained fairly stagnant at 44.3% (male 48.5%, female 40.1%) (EMIS) in the formal primary education schools including IQS since 2012. These figures hide a decreasing trend in the GER of boys but an increase in the GER for girls. Disaggregated by region, GER in 2014-15 was 60% in urban areas and 25.8% in rural areas (EMIS). The above enrolment rates are used as an approximate guide to how many additional learners and therefore how many additional learning spaces and teachers will be required to make GER improve. (See activity matrix at the end of this chapter)
Net Enrolment Ratio 31: The NER in urban areas for 2014-15 was 46.2%, while in rural areas it was 19.6%. During the same period, the Gross Intake Ratio (GIR) for Grade 1 was 94.4, whilst the Net Intake Ratio (NIR) was 23.5% (32% urban and 13.7% rural). This indicates that 70.9% of students start primary school at a later age than the recommended six years of age.
Completion Rates: The 2014-15 Yearbook32 records a survival rate for students who had completed five grades of primary school in 2014-15 period as 63%. The survival rate is usually recorded at 5th grade as this level of education is commonly presumed to be a prerequisite for sustainable literacy33. There is no data available showing the gross rate of completion for primary school (i.e. up to Grade 8) in Somaliland. Although the ESA has concentrated on the GER rates, completion rates are equally, if not more, important as they are clear indicators of efficiency and quality in the system.
Repetition Rates: The average repetition rate in primary school for the 2014-15 period was 2%, with girls’ repetition rates higher than that for boys (2.2% and 1.9%, respectively) in all classes except in class 8, where the repetition rate was equal but lower for both genders. For girls, the repetition rates are highest in classes 2 and 4, and for boys it is in Grades 2 and 3.
Student Performance: The only data available for use in the ESA 2012-16 for performance scores revealed that at Grade 4 level, the average score in a Measuring Learning Achievement (MLA), based on a cross sampling was 23%34 for mathematics. This is alarmingly low as the competencies assessed were at a very low level. The equivalent scores for literacy at grade 4 were a little better with approximately 45% able to operate at the simple sentence level in terms of understanding and responding appropriately. The literacy rate is a common indicator of student performance. According to Africa Educational Trust working with the Ministry and again using a cross sample MLA Report for Grade 7 (2013) showed that students are generally performing reasonably well in Somali literacy as only 11.5%35 who scored less than 20%, were deemed to have failed to achieve basic literacy and were unable to express themselves in their own language. In contrast over 60% were achieving high marks. The weakest skill area was writing which showed a clear weakness with only 25% able to write a competent paragraph. Considering relatively high numbers of drop-outs the actual performance levels could be significantly worse. However, the same Grade 7 MLA showed considerably lower performance levels in numeracy with 45% scoring under 20% on the simple tests and only a third passing the exam (i.e. scoring 60% or more).
Pupil-Teacher Ratio: Although the Ministry may not have recruited the additional 500 teachers promised in the previous ESSP, they have recruited sufficient numbers to maintain, in fact marginally improve, the student teacher ratio. Within the context of FPE the ratio could have risen dangerously (above the agreed benchmark of 1:45). The Pupil Teacher Ratio (PTR) for formal primary education has improved from 32:1 in 2011/12 to 31:1 in 2014/15. However, the percentage of qualified teachers has steadily declined between 2011 and 2015. A ratio of around 30:1 is usually seen as acceptable at primary level, but it may hide a much poorer ratio in some schools, especially poorer urban areas and it hides the increasing number of under qualified teachers being used.
.Pupil-Textbook Ratio: Apart from mathematics textbooks (0.43, or 2.3 pupils per textbook in 2014-15), there is no data on the current pupil-textbook ratio in primary schools. However, based on hearsay of teachers and inspectors we can say that the ratio probably worsened over the four years. Recently this issue was addressed by the Ministry who has had textbooks written and published for all subjects, however, at present they are only available to learners who can purchase them.
Inclusive education: The definitions of special needs are very narrow and there are very few statistics that can measure the numbers involved and little is being done to address their needs at any level with the result that very few children with special needs can access education or fulfil their potential.
Gender Parity Index (GPI): It is positive to note that the GPI for primary education has indeed increased over for the last four years from 0.76 to 0.83. This shows that the previous work and campaigns have had some success and should be extended until the planned parity has been achieved ensuring that girls are receiving equal opportunities in accessing learning facilities. Access to education facilities by those persons with physical disabilities continues to be a challenge although no reliable statistics exist. In fact, that lack of statistics is in itself indicative of existing attitudes to disability as a low priority issue.
Barriers for girls. As shown below shows that female teachers comprised between 15% in 2012 and then 20% in 2014, dropping back to 14% in 2015. The Statistics Year book for 2014/15 also states that 16% of Government teachers are female, whilst 14% of non-government primary schools are female. Whilst this decrease may not be significant in the long-run, the figures depict a poor gender balance in the teaching force at primary level. Further, this imbalance may limit equity in and access to support services for girls and women and deprives girls of role models. Similarly, the percentage of female students is below 50% (as already show by GPI figures earlier), indicating that access to school falls short of the target as far as equity (and potentially, teacher and pupil perspectives and expectations) is concerned. As such, limited progress has been made with creating enabling environments for girls in schools.
However, numbers appear to be increasing. At the same time, as there is a gap in the data for this indicator for the 2012-12 period, it is not clear whether there is a rising trend until data for 2015-16 is assessed (currently in progress).
Schools and classrooms built: Starting from extremely modest levels, by 2015 a total of 1,083 primary schools in Somaliland were built, and representing an annual growth rate of almost 4%. At the same time, ABE centres, which are included in this school count, declined due to the trend of transforming them into formal primary schools. As reported in the ESA, the construction programme largely achieved the original objectives of keeping up with any growth in enrolment, and as a result, the average class to learners’ ratio has improved significantly and now stands at 46. However, there remain concerns about the distribution of learning spaces because some urban areas tend to have overcrowded classrooms while some rural schools have very small, and therefore uneconomic, class numbers. In addition, issues remain with the quality of many school facilities in terms of water, office space and space for play areas.
The Pupil Classroom Ratio (PCR) for formal primary including IQS has gradually
decreased from 57:1 in 2011-12 to 46:1 in 2014-15. However, there is a significant disparity between urban and rural settings for this indicator, with the PCR being on average of 25.1 pupils in rural areas over the four-year period. The long distances they have to travel may cause the low numbers attending school in rural areas.
School Feeding programmes: Another key factor, evidenced in the ESA, that impacts on attendance, especially attendance of girls, is related to the availability of school feeding programmes. For the period 2012 and 2016, the target was set to provide 200 primary schools with facilities for school feeding including take-home rations for girls in these schools. EMIS reports show that, of the targeted schools, 172 schools were reached and 18,548 girls received take- home rations.
Efficiency, relevance, quality of learning: Poor transition and high drop-out rates are generally strong indicators for education inefficiencies. However, as reported in ESA, statistical information is limited, and cohort studies non-existent. Indications might suggest that the drop-out rates, especially in upper primary, are potentially high, but drop-out rates are not properly incorporated into the analysis due to poor monitoring mechanisms. Consequently, no definite statement can be made, other than suggesting additional inputs are built in in terms of statistical methodology when collecting this data, especially cohort studies
Curriculum revision and development: It is reported in the ESA that, on the whole, good progress was made in this area. However, concerns remain as to whether the crucial cross cutting issues and skills specifications that are clearly laid out in the Framework are transferred into the syllabi and the textbooks and finally into the classrooms. Continued monitoring in this area and special observation on how the curriculum framework is implemented remain issues for the forthcoming period.
Teachers: deployment, qualifications, key performance indicators
According to the Somaliland Education Statistics Yearbook, 2014/15, the total number of teachers in primary school (FPE and IQS) has risen from 6,119 in 2012-13 to 7,765 in 2014-1537. While numbers show an inconsistent pattern from year-to-year, the only obvious trend is that number of teachers has been steadily increasing over time, with proportionally greater increases in the number of male teachers compared to female teachers.
Deployment of teachers. The distribution of teachers between urban and rural areas is highly skewed, with 64% of all teachers stationed in urban schools, compared to only 36% in rural areas. This is skewed as some 52% of the school going children are found in urban areas compared to close to 45% in rural areas (rural and pastoral/nomadic communities combined). This distribution of teachers suggests significant inequities in the distribution of education resources in Somaliland that aggravate existing patterns of social and economic exclusion of rural and nomadic areas. These trends need to be reviewed in the context of much lower size of classes in rural areas and the possibility of trialling boarding schools as a way of increasing rural enrolment. One other alternative remedy to small classes could be to increase the number of rural schools, accept the small class sizes in areas of low population density and use multi-grade teaching approaches.
Teaching Hours. According to the National Education Policy38, students at primary school level are required to learn 8 subjects for a total of 36 periods, comprising 27 teaching hours every week. There is no data capturing the number of teaching hours timetabled or actually taught during the 2012-16 period. The actual state of teacher attendance can be presumed to be low. This can be evidenced through a number of factors, including comments from Quality Assurance Officers, and may be caused by low professional morale, insufficient teaching resources and, most importantly, low teacher remuneration. In fact, high teacher absenteeism, is widespread internationally, and particularly in developing countries39.
Remuneration of teachers and managers. One of the overriding concerns has been the absence of attractive conditions of service, lack of career schemes and total absence of performance related remuneration for senior teaching staff, including head teachers. As demonstrated in the ESA, the present allocation of finances to teacher remuneration is not only dangerously insufficient in comparison to other developing countries, it also allows for inequitable treatment of teaching staff from region to region.
Increasing gap between public and private education. The ESA has documented that quality across all education subsectors remains a constant challenge as evidenced by rather low achievement levels described above in the MLA results. This may have contributed to an increasing trend towards privatisation of basic (primary and secondary) education, largely driven by the low quality delivery of public services and partly attributable to low quality of teachers and low professional morale, as well as poor infrastructure and lack of equipment in public schools. Private education can provide significant stimuli to the public sector and makes a major contribution (about 30%) to improved access. However, both should compete on a comparable financial basis and the public sector should not subsidise private education. In addition, the Ministry must ensure that the private sector meets minimum standards and is compliant with the National Education Policy.
Data Availability and Smart Indicators. At present, the greatest drawback, both to planning and evaluating progress under any plan, is the lack of key indicators that can be used for comparison. In theory, we could create many of these indicators retrogressively if the data was sufficiently robust. Unfortunately, much of the data can be faulted, as it is not always collecting like for like each year. E.g. private schools are not included in all the statistics in earlier years and not all statistics have been validated.
Student Performance. The only data recovered for performance scores revealed that at Grade 4 level, the average score is 23% in mathematics. The literacy rate is a common indicator of student performance, but, as previously stated, the MOEHS does not have official data on literacy for the whole Republic of Somaliland.
Results of Monitoring Learning Achievement for Grade
Monitoring Learning Achievements (MLA) (or ‘Measuring Learning Achievements’ and also used as an acronym for Minimum Learning Achievements) is one of the most commonly used learning achievement tests. It represents a standardized approach to testing at various stages to see what levels of learning have been achieved. This tool can be used to measure the success of the quality aspects of the ESSP, particularly since data is available from 2012 and 2013 against which future improvements in performance can be measured.
Measuring learning achievements in Grade Four (MLA4) in Somaliland was a requirement in ICDSEA1 under Result 4, which aimed to strengthen the capacity of departments within Ministries of Education to measure and deliver quality in education. As a result of the issues raised by MLA4, it was agreed by the Ministry of Education that a similar study should be carried out in Grade Seven and that these assessments of learning achievements should be a regular part of the monitoring of the education system. Whereas MLA4 was funded by the European Community, MLA7 was funded by UNICEF and was a part of the project to support examinations and assessment across the whole of Somalia (FACSS).
In March 2012, findings from MLA4 concluded that numeracy was by far the weakest of the key competencies and recommended urgent remedial action to address how numeracy was taught. The findings from these tests for MLA7 in June 2013 confirm this.
Any discussion of results needs to look at the scores on individual items rather than the overall score to value the diagnostic implications for the delivery of curriculum. Thus, in the full report the results are described initially in terms of competences achieved as indicated by specific test items before reporting on the overall scores.
According to the Africa Education Trust Measuring Learning Achievements (MLA) Report for Grade 7 (2014) it is clear that students are generally performing well in Somali and that all but between 4% and 7% have achieved basic literacy and can express themselves in their own language. Some 34% are achieving high marks. However, there remains a weakness in their writing that will result in a weakness in writing any other languages they learn. Students have performed satisfactorily in science but at a slightly lower level than in Somali, and with fewer excelling but a majority in the middle range of scores. English, though clearly weaker in the writing and paragraph comprehension, parallels the results in Somali. These are better than one would expect from students without textbooks and with very little exposure to the language. Maths is clearly the weakest subject, with 34% having very weak numeracy skills and only 32% actually passing. Numeracy and mathematics has been shown to be weak in form four exams, in Grade 8 exams, in MLA 4 and in studies done on non- formal education.
School Environment and Risk Management. There is very little supporting data available on implementation of risk management practices either at baseline or since. In a context such as Somaliland, education delivery both needs protection against risk and is in itself a means of risk prevention, protection and peace building. This was well-illustrated through the risk management and peacebuilding approach taken in curriculum development consultative process that was supported by UNICEF and managed by AET (see full ESA for further detail).
- Secondary Education
6.1 Situation Analysis
Secondary education in Somaliland spans four years, from Form 1 to 4, and is divided into junior secondary (Forms 1 to 2) and senior secondary (Forms 3 and 4). Entrance to secondary education is, in theory, determined by the centrally administered standardized examinations at the end of class 8 (the last year of primary education). The MOEHS National Policy of Education (2015) targeted a Gross Enrolment Ratio (GER) of 50% by 2016. In fact, as of 2015, the GER was only 21.3% (boys 25%, girls 17%) and the Net Enrolment Rate (NER), was 10.5% (boys 11.6%, girls 9%) for the same period. Whilst explicit data describing the age range of enrolled secondary students was not available, the difference between NER and GER shows that approximately 50% of students are not within the appropriate age group of 14 to 17 years. The real entry age for secondary education varies due to access limitations, such as cost of education, in addition to late completion of primary school resulting in a high proportion of secondary students being over-age.
Just over half (55.6%) of the secondary school students are enrolled in government- owned schools. Private schools therefore have a significant share of students in the secondary sector. This correlates with the regional distribution of private secondary schools, most of which are in urban areas where economic conditions are better and families can afford higher school costs. Private schools also have better gender ratios, with 43.1% of students in private schools being girls in contrast to only 35.3% in government-run schools. This difference also springs from the reality that public secondary schools are situated in more disadvantaged regions that experience greater social barriers to girl’s participation in education.
In this subsector, as elsewhere, teachers give private classes for students at a cost, giving an advantage to those students who can afford it and benefiting teachers who are paid by parents. This practice raises issues of equity (and perhaps the effectiveness of those teachers in their ‘normal’ classes). However, this practice also keeps the best teachers within the government system as it ensures that they earn a reasonable income and are thus less inclined to move entirely to private schools.
Some of the critical challenges facing the secondary education sector in Somaliland are summarised from the full ESA below.
Enrolment. Although the Annual Average Growth in the rate of enrolment has remained high (54% between 2012 and 2015), there remains a major shortfall when measured in terms the GER of 21% in 2015. Even when accounting for overage learning in primary school, the majority of 14-17 year olds remain out-of-school (estimated at over 50%).
As shown in above, enrolment in the final year of secondary school is lower than in the first year by approximately 28% for boys and 42% for girls. There is no survey data with a cohort study that could confirm the reasons for this difference. However, the report suggests two reasons. Firstly it is the result of the 13.5% increase in enrolment over the past several years resulting in approximately 54% increase in school enrolment over time. This accounts for some of the differences between form 1 and form 4, i.e. it is a result of successful expansion each year. Secondly, dropout rates increase from Form 1 to Form 4, which accounts for the remaining differences between levels. For example, the Somaliland Multiple Indicator Cluster Survey (2014) observed that one in every two of the primary school age children are in primary school and this declines even further to one in five of secondary school age children attending secondary school42. Again, this observation could be the result of the increases in enrolment each year and/or as a result of dropout.
Figure 7. Secondary Enrolment by Form for the year 2014/15
Equity. There are major inequities in the system that need to be addressed. These include the gender divide (GPI is 0.84 EMIS 2015/2016). The data for rural-urban divide is currently not available for Somaliland, whilst only 10% of teachers are deployed in rural areas) and the rich-poor divide. These may be the result of poor distribution of classes and teachers or may be the result of wealthier households able to pay for the best teachers and schools while poorer households are left under- resourced via the public school system.
Female teachers: The number of female teachers in the system is only 78, or 4% of all secondary school teachers. The lack of female teachers and therefore, lack of female role models for girls in school, is a major source of concern.
Teacher Qualifications and Capacity
The draft teachers’ policy document shows that the minimum standard of qualification and certification for secondary education teachers requires at a minimum that teachers hold a diploma in teaching. As of 2014-1544, 993 teachers (55%) are qualified at diploma level or above, as shown below. Over a third of teachers qualifications were “not defined”, presenting doubts on the quality of education for students being taught by potentially unqualified staff. This contrasts with 2011 when out of 1,112 teachers only 12%, i.e. 178 teachers were not qualified. Thus, over the last four years, while teacher recruitment has kept pace with increasing enrolment, teacher qualification has fallen behind. Moreover, as shown in Table 33 the distribution of secondary teachers
between urban and rural areas shows massive inequities in the provision of services. Some 90% of secondary teachers are stationed in ‘urban’ areas compared to only 10% in rural areas. While this can be understood in a number of different ways, such as limited access and supply of primary education facilities in rural areas decreasing demand at secondary level, it also reflects the impact that inequities in primary education which are reproduced at secondary level and further aggravate vulnerability and risk for young people in rural areas.
The average percentage of qualified secondary school teachers was 55.1%. These comprised of 55.2% of total male teachers and 52.3% of total female teachers. As shown below, while the proportion of qualified teachers is higher among female teachers, in absolute numbers this translates to only 2.3% of all qualified teachers being female as only 4% of the total teaching population is female.
The percentage of qualified secondary school teachers has decreased from 84% in 2010/11 to 55.1% in 2014/15. While this suggests a significant decline, caveats exist due to the accuracy of teachers’ data and that the qualification of some teachers is not defined in the ESSP database (i.e. some qualified teachers may be listed as not being qualified). Furthermore, according to the MOEHS Education Sector Strategic Plan (2012-2016), many secondary teachers obtained their training outside Somaliland and thus may not be recorded correctly inside Somaliland45.
Pupil-Classroom Ratio. In Somaliland, the total secondary education Pupil Classroom Ratio (PCR) is 42.7 students per classroom. The PCR in government- managed schools is 40.4 students per classroom and in the non-government secondary schools it is 45.9 students per classroom. This indicates that on average private schools have slightly larger class sizes than government schools. This is probably because of the small class sizes in rural areas where government managed public schools have a much greater presence compared to private run secondary schools which are concentrated in urban areas. However, in Hargeisa private schools have significantly smaller class sizes than their government equivalents, suggesting the government run-schools are more accessible to poorer urban households resulting in overcrowding.
Pupil-Teacher Ratio. The total teaching force currently serving in the secondary education sector is 1,804 teachers, of whom only 78 are female (or 4%, see Table 13). This compares with 1, 112 teachers in 2011 and thus represents a rate of increase of 62%. This matches well with the growth in student numbers. The teaching force was expanding by a rate of 62% while student enrolment expanded by rate of 54% resulting in a slightly improved student teacher ratio. However, as in the primary sub-sector this was achieved by using an increasing number of unqualified teachers which may have had a negative impact upon quality of learning in secondary schools.
Learning Environment
Schools. There are 100 secondary schools, most of which are located in urban areas, with 37 private schools and the rest public46. Of the 63 public secondary schools, seven operate double shift systems in order to maximize learning spaces and accommodate high student number in urban areas.
Classrooms. The total number of classrooms in formal secondary school has increased progressively over the period of the outgoing ESSP, from 679 classrooms in 2010/11 to 1,122 in 2014/1547. This consists of growth in both government and private schools combined and represent a rate of growth of 65% in new learning spaces, and exceed the 54% rate of growth in new students in the education system. This is reinforced by the 2014 ratio of classrooms to learners at an average of 43 pupils per classroom.
Quality: There have been major deficiencies in all areas that deliver quality. These include a decline in the numbers of teachers who are qualified and a lack of teaching learning materials, textbooks, equipment and general facilities. The average percentage of qualified teachers is 55.1%, whilst 55% of all secondary schools reported lacking libraries and laboratories.
Student Learning Outcomes
The data on student outcomes is limited and the implications for this are severe, as student performance at primary and secondary levels is a key indicator of external efficiency. However, EMIS has data on the exit level candidates (Form 4) who achieved the minimum acceptable performance of 50% or above.
Data shows that of students who registered for the Form 4 examination (7,799 students), a total of 6,218 achieved 50% or above. This indicates that 79.7% of all Form 4 students registered for the exam, with 81.3% of students who completed the exam achieving scores of 50% and above. Only 1.9% of the registered students were absent from the exam. From the total registered male students, and from the total registered female students, 79.4% and 80.4% respectively achieved 50% and above. This indicates that a slightly higher percentage of female students scored 50% and above compared to males. However, there are significant gaps in the data, including the percentage difference in scores between the highest and lowest percentiles, and disaggregation by subject. Further analysis of learning outcomes at secondary level, or comparisons with 2011 outcomes, is recommended to be completed by the Examination Board within the ministry as it has control of the full results (see full ESA report for details).
Areas that need further research: Dropout rates. Further studies are needed into enrolment increases, transition rates and dropout rates.
Research into the needs for secondary level education in rural areas need to be examined based on grade 5-8 statistics. Where unit size may not be fully economic, then alternative strategies need to be discussed including the possibilities of boarding schools, multi-grade teaching web-based or other forms of technologies to deliver courses, and unit costs considered in all cases.
- Non-Formal Education (NFE)
7.1 Situation Analysis
Non formal Education (NFE) is defined as a practical and functional mix of fundamental literacy, numeracy and skills for life. It focuses on community or district-based programs that engage out-of-school youth in learning in order to prepare them to improve their life opportunities and/or successfully enter high growth occupations and careers. The Ministry of Education’s department of Non-Formal Education (NFE) seeks to foster lifelong education and support services. It provides services for youth/adult learning, girls/women’s learning spaces and family learning centres that enable individuals to access education in various life skills that equip them with the ability to generate sustainable and healthy livelihoods, while developing as informed and skilled citizens.
Currently the Non-Formal Education Program operates without training manuals or standardized curriculum. A lot of capacity strengthening is required. The NFE department in order to ensure delivery of quality education and training services needs to develop its capacity and human resources. This includes the development of rural educational strategies programs and improvement of advanced level of NFE linkages to the other education subsectors, establishment of an equivalency certification system and Institutionalization of NFE teachers and provision of in-service teacher training on regular basis. There are a total of 260 NFE centres across Somaliland with which the MOEHS is involved. The following Table about the regional NFE Enrolment between the years 2014 and 2015 is the only available data according to the monitoring reports collected by the Ministry of Education and Higher Studies in collaboration with all stakeholders/ partners.
Only a quarter of women in Somaliland are literate (see full ESA for details). This varies greatly by region and rural-urban divide. The existing NFE centres provide literacy and numeracy for adults and out of school youths, the age category for this target group is between 15 to 45 years. As shown in Table 22 above, the proportion of female students is 64%.
The key challenges in the NFE subsector are summarized as follows:
- Just like most other subsectors, financial resources, especially from public funding remain This, coupled with inadequately trained personnel, tends to lower the quality of education services in NFE facilities
- The NFE subsector does not have an up-to-date comprehensive policy that will guide and facilitate the running of the sector and ensure that the sector imparts life skills to learners who did not have a chance of formal
- As currently equipped, NFE facilities have limited learning materials to support learning especially in life skills training and in particular equipment for practical lea
- There are gaps regarding awareness of the NFE programme among the Somaliland communities and the important role it plays in imparting basic literacy and numeracy skills to
- The Ministry is facing challenges in the implementation of Family Education Centres (FLECS) due to limited
- There is lack of data and documents regarding the achievements of teacher recruitment, selection, training and There is also a shortage of relevant educational materials including textbooks and supplementary reading resources, particularly in the rural learning canters. The EMIS does not incorporate the NFE subsector.
- Technical and Vocational Education and Training
8.1 Situation Analysis
Although high in demand, the TVET Department at the Ministry of Education continues to suffer from lack of organization, access and a disjuncture between private and public vocational services. Reliable data is still a problem as the TVET subsector was included in the EMIS census only since 2015. Currently the TVET department offers formal public secondary school services in the Technical schools in Hargeisa, Burao and one technical Agricultural school on the outskirts of Burao. However, the majority of TVET institutions are privately owned and administered independently from the MOEHS. These schools are project-based and their longevity depends on the lifespan of donor funding for projects. Therefore, sustainability is a major challenge in the TVET private sector. There are many challenges hindering this subsector as noted below.
Fragmentation and data availability. TVET programming in Somaliland is currently fragmented due to the manner in which these programmes are implemented. With the assistance of Development and Implementing Partners a wide spectrum of initiatives and activities have been implemented over the years but there is a lack of formalized documentation to assess initiatives and results in this subsector.
Weak policy implementation. As documented in the ESA a number of far reaching initiatives were proposed in the outgoing ESSP 2012-2016, with the potential to create enabling conditions for developing a concise, structured TVET subsector, including:
The 2011 National Vocational Qualifications Framework (VQF)49, was developed and has not been reviewed. In addition, a draft TVQA Bill was developed but not finalized. Therefore, the TVQA need to be revised to address the ambiguities in the roles and responsibilities between the TVET Department and TVQA Authority. Furthermore, VQF should be revised so that it will be line with the TVET Strategy, current labour market demand and the ESSP 2017-2021.
Standardization of all qualifications and credentials is an important element in a structured, consistent education system. This would gradually address the current problem of questionable qualifications (diplomas and degrees) thus creating a national, binding system of qualifications for all education and training providers;
- A comprehensive revision of curricula towards output/ learning outcome- based, or results-based, with defined levels (modular structure) and linked to NQF, skills and knowledge competencies;
- Specification of occupations or trades (with recognized qualification profiles), ensuring national and regional recognition (gazetting, standards);
- Concepts and plans to implement the training of instructors/ TVET teachers, albeit without full consideration of heads as managers of TVET institutions/ col
- However, it is noted that their transformation into binding norms is yet to be effected as none of these initiatives were fully
Lack of management capacity. TVET has remained an under-funded subsector and the near-total absence of subsector-wide monitoring by the MOEHS suggests a fundamental management inefficiency and lack of capacity. However, a department for TVET was created in the compound of the MOEHS with a fully functional equipped building but clear guidelines on reporting and job profiles are yet to be developed and applied.
Limitations. Given the extremely sporadic data available (extensively elaborated in the ESA and above) any attempt to develop a realistic assessment of the cost to develop the sector is seriously curtailed. This handicap is exacerbated by a number of other factors: Operationalized policy statements with clear-cut (quantitative) indicators are for the most part absent. The 2012 ESSP stated that per annum one new training centre should be created/refurbished, with a capacity of 360 trainees50. No costing or financing plan had been developed against which the present situation could be measured, and serve as a basis for better planning. As discussed more fully in the ESA the existing (oldest) TVET Centre in Hargeisa received funds (from implementing partners) for upgrading, and there is an initiative to re-build the (totally destroyed) Burao TVET centre underway, with the help of implementing/development partners at the end of the out-phasing ESSP. None of the proposed initiatives to introduce “mobile” TVET training in order to reach out to the rural areas and provide training opportunities to the disadvantaged rural young women and men 51 ” has been documented (for verification). Thus, the information and funding bases advise on good caution and modest planning: what cannot be financed cannot be planned for. Availability (or at least solid prospects) of funding is the defining bottleneck for the planning of sector initiatives.
Financing of the sector. Funding from the national budget for the TVET subsector is rather constrained, not allowing any significant expansion of the subsector. Given other serious requirements to raise the funding for other subsectors, notably in basic (primary and secondary as well as ABE) education, there is no reason to assume any growth in public funded TVET in the near future.
One approach to change the impasse, mentioned above, could be to channel all significant donor funding through the national development (or similar fund), and this, if well managed by the TVET Authority, could result in management gains (due to reduced transaction and other costs).
In addition, alternative sources should be made available, by shifting the need for funding to the beneficiaries. Given that the majority of TVET trainees are from the poorest strata of society, it cannot be expected to collect fees from trainees. However, the key beneficiary, which is the country’s economy, should participate in expanding TVET.
- Higher Education
9.1 Situation Analysis
The Education Sector Analysis (2012-2016) observed that the Higher Education (HE) sector is relatively new in Somaliland. As a result, data on university education in Somaliland is extremely limited due to lack of regulation of institutions and insufficient Ministry involvement. In the recent decade the growth of tertiary education has been significant. From the core of established universities ranging back to the 1990’s such as Amoud, Hargeisa, Gollis and Burao University an impressive growth has emerged to 35 recognised universities in the country53 . Very similar to the private largely unregulated economic sector the rapid growth of the HE sector has followed initiatives, mostly privately driven, be it as possible business ventures, or more often from philanthropic motives, often in the form of joint ventures. This is a reason for the diversity of university programmes and status (public / private), and it is clear that the majority of the usually much smaller universities are still private initiatives. Almost all universities were founded by diaspora and local communities but are now considered public institutions under the authority of the Somaliland government.
The remaining under 20 autonomous universities founded by NGOs or private entities are generally self-financing through student fees. The Universities receive limited support from external donors, which include the Somali diaspora, the Developing Partners, including United Nations Agencies, and local major stakeholders. Overall participation has grown significantly and the latest annual enrolment stands at approximately 13,000 students.
Student ratios and Lecturer Qualification
A 2013 survey on HEIs in Somalia (Including Somaliland) revealed the following information on select universities: Hargeisa, Amoud and Gollis, which represent the three largest universities in Somaliland. Table 19 summarizes the number of lecturers provided per year in the three universities. There are clearly regional disparities in terms of student population and student-lecturer ratio. In Gollis university, despite having the smallest student body and fewest lecturers, the student-lecturer ratio is highest.
Lecturer qualifications
In Somaliland’s three largest universities, lecturer qualifications range from Bachelor’s Degree to PhD degree, as shown below.
Whilst the data above is not representative considering the few number of universities surveyed, it is reflective of realities experienced by the three most established public universities in the country. Of 437 recorded university lecturers, a total of 57% only have a Bachelor’s Degree. The university with the greatest proportion of lecturers with a bachelor’s degree is Hargeisa University, with 97%, with Amoud and Gollis each with around 25% of lecturers have a Bachelor’s Degree. While just under 5% of all lecturers hold a PhD, Gollis University has the highest proportion with 32% of lecturers hold a PhD (8), compared to Hargeisa University which has only 1.5% of lecturers having a PhD (3). Even though Hargeisa University has a much larger number of lecturers, the total number of those with a PhD (only 3) suggests that, unlike Gollis, Hargeisa University does not have a clear policy or intent to recruit lecturers who have PhDs. While faring better, Amoud University has just under 5% of its lecturers with a PhD
(10). However, Amoud has a large proportion at Master’s level (almost 70%, or 146), compared to 44% (or 11) in Gollis. Hargeisa University thus appears to have least invested in hiring of lecturers with higher academic qualification as only a combined total of lecturers have either a PhD (3) or Master’s (10). The remaining 187 lecturers are all Bachelor degree holders.
Governance: There is an urgent need to develop a structured approach towards strengthening those institutions designed to manage the sector effectively, notably the MOEHS; Directorate for Higher Education and the closely connected Higher Education Commission.
Institutional framework: The present legal framework needs very urgent strengthening. Various draft legal norms have been debated, but there is no reliable framework or corresponding law/ ordinance/decree in place to ensure implementation of good standards. One of the consequences of the largely unregulated higher education sector is the myriad of education institutions, often lacking accountability and transparency. This can lead to fundamental challenges for recognized and reputable institutions and can potentially threaten the good reputation of existing awards (diplomas/certificates)55 and its issuing institutions.
There is an urgent need for building the capacity of the designed managing bodies, the Directorate General for Higher Education and the Commission. Systematic transfer and exchange of experiences with other regional and international HE institutions and their governing bodies is essential, e.g. in the form of ‘learning partnership contracts’. In order to produce meaningful results such liaisons need solid financing over longer periods.
Quality Assurance relevance of programmes : Although no detailed sub-sector wide data has been provided, there is strong indication from ESA 2016 (also confirmed by the source quoted above) that there is a trend towards comparatively much stronger enrolment , also stated in the above table, mostly attributable to stronger participation rates in feeder institutions, notably secondary education schools. HE institutions systematically report about enormous difficulties in maintaining standards, and this, coupled with the existence of completely unregulated private providers raises very serious quality issues, in terms of learning conditions, quality of teaching faculty, relevance of programmes and curricula and other crucial areas. The MOEHS has fully acknowledged that there are severe challenges in regard to quality management of services delivery:
The Minister of Education is committed to ensure that quoted as saying that the “Higher Education Directorate and the [Higher Education] commission will ensure the minimum standard required from universities are is adhered to with rigor. Compliance to the minimum standards checklist will be monitored through regular assessments jointly by the Directorate for Higher Education and the Commission. The Minister also warned universities that fail to meet the minimum standard that they risk losing their accreditation and the right to operate in Somaliland. The Ministry will also ensure a common standard for curriculum is adopted. It would be therefore crucial to make minimum standards compulsory for HE institutions”56. And this would provide the benchmarks for the supervising public institutions. These very essential policy statements however need to be supported by an adequate legal framework to ensure adherence to such policies.
The proposed sector review should also address the issues of existing research capacity, and identify enabling factors to raise volume and quality of research. A pre- requisite to actually achieve this is a capacity building approach of the existing faculties and to ensure a much broader base of doctoral degree holders.
Financing: The ESA suggested that the budget appropriation for HE after years of stagnation at very low levels, was increased in 2016 (from the equivalence of US$ 500,000 to one million in 2016). However, the discussions revealed that the allocation was not followed by implementation, and as a result, no increase in actual financial investments was observed.
The HE sub-sector financing is the most critical single factor that restricts future development of the sector. All public universities are stressed with very limited funding as the provision of public funds distributed over some 15 universities leaves an extremely curtailed and financially difficult situation for university and HE services development, particularly when equitable policies (of promoting women and individuals with physical disabilities) are being considered. It should also be noted that refinancing of the universities is very limited given the very low average income levels. The implications of the severe financial restrictions are immediately plausible:
- Shortage of qualified academic staff
- Insufficient basic infrastructure (in particular adequate laboratories, including ICT access)
- Insufficient access to relevant learning and teaching materials
The potential for involving the private sector, including Somali Diaspora, and other international sponsoring organizations has been recognized by the universities, however this valuable source of support is limited, and cannot replace the role of the State for funding.