Political and History Maps of Somaliland
Geographical and Political and History Maps of Somaliland
Introduction
Maps are sources of information. They have a practical use: they tell us where things are and how to get from one place to another. They teach us about regional and global geography. We can explore cities, roads, and developments, as well as mountains, rivers, forests, and lakes by looking at maps. From the earliest maps charted by the stars to modern GPS systems, maps have long been an important tool in discovery and understanding.
But there is more to the story of maps. Every line drawn on a map is political, for representation always involves interpretation. A mapmaker must decide what to call a disputed territory, defining on paper what is in reality indefinable. Labels reveal which elements of the land are important to the mapmaker, and the language used signifies whom this information is meant for. Maps are made from a particular point of view, towards a specific strategic end. To draw a map is often to claim a monopoly on knowledge production. To use a map is often to exercise power.
Medieval European maps illustrated the world according to Christian theology rather than geographic knowledge, reinforcing a worldview based on scripture. Later, as Renaissance scholars turned to scientific mapping, maps became an important tool in the project of empire. From the 15th to the 17th centuries, the charting of land and sea went hand-‐in-‐hand with the conquering of indigenous civilizations in the Americas. The science of mapmaking was refined in order to locate resources like gold and to illustrate how this ‘New World’ could be claimed and its people exploited.
Centuries of mapmaking expertise have also contributed to the plunder of the African continent, aiding policies of invasion, occupation, and colonization. At the Congo Conference of 1884, European powers divided up the map into artificial zones of economic influence. Their newly drawn maps determined the fates of so many peoples and tribes, disrupting their use of land, freedom of movement, and right to self-‐determination. And as official colonial rule has given way to neocolonial economic domination, maps continue to serve the interests of power, from corporate oil giants to multinational mining operations.
Yet mapmaking is not always malicious. Maps are important to communities, identifying important routes and services and educating residents about their locale. They are important tools for urban planners, who design public transportation, utilities, and waste management. They allow organizers to reach out to their communities, making services and communication routes more accessible and effective. They can even be used as a means of resistance.
The study of maps allows us to utilize information and technology to contribute to the betterment of society. New interactive forms of mapping are changing the way we understand natural and built spaces, and opening up new possibilities of development. At the same time, a deep understanding of the historical role of mapping is important to resisting and recovering from imperial domination. In order to subvert one form of knowledge production, one must understand the motives and methods of oppression. Maps reveal not only the geographic landscape, but also the landscapes of power and global politics. Just as they were essential to conquest, they are essential to liberation.
The new technology offers also opportunities nowadays to be precise in measurements. For instance diverse and conflicting figures are found in the literature for the measurement of Somaliland coastal line (see chapter 4) and this publication attempts to settle the official figures to be used. Somaliland Ministry of Foreign Affairs partly facilitated our research by offering us support in publication and display the collection in public within its perimeters.
Maps – history
Maps are some of the oldest surviving records of ancient human civilization in the world, dating as far back as 16,500 BCE. They reveal the development of geographic knowledge in addition to providing clues about the civilizations that created them. Ancient peoples depicted the stars on cave walls and used simple symbols to describe their villages and the surrounding landscape. Babylonians seem to have developed a mathematical surveying system, creating scaled maps of valleys and cities on clay tablets. They also created the earliest known world map, which reveals not only the extent of their geographic understanding but also their theological conception of the world.
Ancient Greek maps of the world depict various conceptions of its shape—from a tall cylinder to a flat disk—and the results of early exploration, with distance estimated by “days of sailing.” Meanwhile, the oldest known economic maps were drawn in ancient China, showing the relative locations of natural resources and roads. Ancient Chinese mapping contributed to extensive collections of geographic knowledge. Later, the Mongol Empire made geographic maps central to its conquest.
Through the political, military, and intellectual interactions of ancient empires, and later through trade, mapmaking kept apace with geographic knowledge expanding from these civilisation hubs. Medieval Muslim scholars complied geographic information from earlier traditions and from explorers and merchants traversing the land, eventually producing world maps and atlases. By the 16th century, Ottoman maps began including the Americas.
Early European encounters with the Americas spurred the rapid development of mapmaking and geographic knowledge, in what is known as the ‘Age of Exploration.’ As mapmakers developed new surveying techniques and refined their estimations of the Atlantic Ocean and their ‘New World,’ they created new ways of drawing and projecting the world.
Advances in mapmaking had direct consequences for expanding European empires in this age. Geographic knowledge of the globe aided in the conquest, and later the colonization, of lands from the Americas to Africa to Asia and the Pacific Islands. Accordingly, geography developed into an essential tool for expansionist militaries in Europe and the United States in the modern era. Significant examples of the exercise of dominance through geographic division include the Congo Conference of 1884, which divided Africa into spheres of European influence, and the Sykes-‐Picot Agreement of 1916, which did the same in the Middle East.
While the most studied tradition of mapmaking involves global exploration and later expansion and conquest, a wide variety of indigenous mapping practices have served other purposes. Early settlers of the Pacific islands devised systems to describe wave and wind patterns among the islands. Some indigenous tribes of North America drew temporary diagrams in sand to describe the local landscape or give directions to a traveler, while others made star charts to mark the seasons.1 Various African peoples have modeled buildings and villages on maps of the cosmos, while others developed practical representations of water resources.2
Maps have also been used to resist domination. For example, Indonesian communities have created maps that assert their right to their land, contributing to an effort to stop logging and oil production in the forests. Residents of Tanzanian slums have used GPS system to map their previously uncharted communities as an attempt to get needed services like drainage and waste collection. 3 Centuries after colonization began, indigenous communities in present-‐day Canada are using maps to assert their right to occupy and use their land in traditional ways.
Maps are not limited to global geography; we have mapped everything from the veins of a leaf to the human brain to the Milky Way Galaxy. As mapping technologies develop at an exponential rate, the way we interact with spaces, places, people, and things is transforming. Maps can be accessed through the Internet and on mobile phones. Many maps are interactive, offering a variety of views and perspectives on a single location. Many public-‐use maps depend on user input, offering information not only about location but also about the experience of the place. All of these elements of mapping are central to inquiry and the pursuit of knowledge, just as has been the case for thousands of years.
The collection
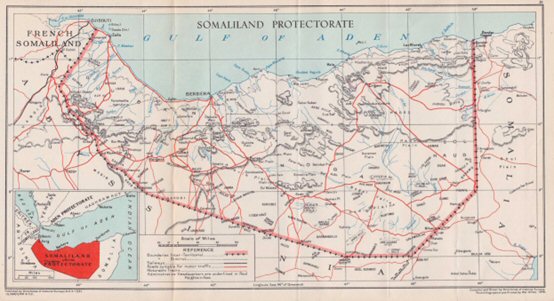
The Hargeysa Cultural Center has obtained a collection of historical maps representing Somalia, Somaliland, and the surrounding regions. Produced in the early to mid twentieth century by colonial British and Italian administrations, they are rare vestiges of an important piece of Somaliland history.
The collection comprises geological surveys published between 1955 and 1960 by the British protectorate and Italian political and military maps from the 1930s, as well as maps representing regional vegetation, tribal migration, and proposed railway routes.
The maps display the tactical information used by colonial militaries to gain control of the land and its peoples, including topographical features, settlements, and infrastructure. Additionally, geological and anthropological maps are products of colonial investment in singular knowledge production in particular by the British administration.
The maps collected here represent the minority of such documents that survived the civil war of 1988-‐1991 and its aftermath. In addition to the loss of such historical materials, Somaliland continues to suffer from a lack of cultural institutions to preserve remaining documents. The HCC has recognized the value of these maps and took custody of this material, which joins a growing collection of books, manuscripts, cassettes, and other materials already preserved here. This archive serves to document Somaliland history as well as platform to share its insights with the public.
The display
The Hargeysa Cultural Center displayed its collection of historical maps from January through July 2016 in the gallery at its Hargeysa premises. The exhibition was open to the public during regular business hours. Visitors had the opportunity to examine these original documents produced in the 20th century by colonial institutions, in addition to engaging with the history of mapmaking and its significance in the colonial context. A second public display of the collection took place at the permits of the Ministry of Foreign Affairs in Hargeysa between November and December 2016. Other exhibitions are planned in 2017.
While these maps were made by European powers for the purposes of political and economic domination, they nevertheless represent an important element of Somaliland’s history. Understanding the history of Somalia and Somaliland through the lens of the colonizers is essential to deconstructing the singular narratives these administrations have imposed upon the region. Further, by presenting these materials in a new, postcolonial context, the HCC aims to appropriate the information contained therein as part of our reclamation of our historical identity.
The HCC remains committed to the cultural and intellectual development of Somaliland society. The collection of maps and other historical materials is essential to this development. The preservation and archiving undertaken by the center fill the void left by the destruction of museums and other cultural institutions in the country. Additionally, public exhibitions serve the community by providing access to information that would otherwise remain unknown. We are proud and humbled by the opportunity to share these documents with the public, and hope that it will contribute to the flourishing of Somaliland’s intellectual, academic, and cultural traditions.
Measurements – Somaliland coastal line and area
In the literature, it has been difficult to find an agreed measure of the coastal line and the area measurement of Somaliland, although it has been a defined administrative territory since 1884. Official colonial documents estimate the area of Somaliland as 60000 square miles (155,399 square km)4. Wiki commons says 137,000 square km. Anthony Kirk-‐Greene, On Crown Service (London: 1B Tauris, 1999) Table 2.8 says that in 1939 Somaliland covered an area of 68,000 square miles5. Similar thing happens when it comes to the coastal line of Somaliland. Official documents say 850km but recent measurements, which measured the actual coastal line as opposed to historic aerial or naval measurements, indicate that this figure may be an overestimate of true measure.
This is not a Somaliland only problem. In fact “determining the length of a country’s coastline is not as simple as it first appears, as first considered by L. F. Richardson (1881-‐1953) and sometimes known as the Richardson effect” (Mandelbrot 1983, p. 28). The scale of the ruler you use for the measurements determine the answer you get, and this what is called coastline paradox. “A shorter ruler measures more of the sinuosity of bays and inlets than a larger one, so the estimated length continues to increase as the ruler length decreases.”
The coastline paradox is an interesting topic that comes back on the discussion nowadays because the new technology, in particularly satellite photography and measurements, allows more precision on measuring the coastline. The ground breaking scientific paper “How Long Is the Coast of Britain? Statistical Self-‐ Similarity and Fractional” by Benoit Mandelbrot in 1967 took as an example the west coast of Britain because “it looks like one of the most irregular coastline in the world.” The paper stated, “Seacoast shapes are examples of highly involved curves such that each of their portion can be considered a reduced-‐scale image of the whole”, and concluded, “speaking of a length for such figures is usually meaningless” [Mandelbrot, 1967]. Earlier studies indicated how the change of the scale and precision may effect the figures cited for geographical purposes, for instance Steinhaus writes ‘‘the left bank of the Vistula, when measured with increased precision, would furnish lengths ten, a hundred or even a thousand times as great as the length read off the school map’’ [Steinhaus, 1954].
There is huge variation of the measurement therefore in relation to the scale of the map. The Ordinance Survey measured and gave it to 11072 miles (or 17820km). For instance measurements in different scale show that the coastal line of the United Kingdom is calculated in 3960km when the scale of the map is 1:2,000,000. Researchers obtained that when doubled the scale in 1:1,000,000 the coastal line length becomes 4300, and when furthermore doubled the scale in 1:500,000, the length change to 4800 while if it still doubled, we have 6182Km and there is a difference of above 2000KM.
The new technology offers to us to be more precise. Using google map, for instant, we scaled down to 1:5000 which gives us a very detailed information and precision on the distance of the map.
Delimiting borders in Somaliland, mainly in the eastern part also show some discrepancies on the available maps. The area is highly politicized recently and, in our measurement, we refer to the maps that has been produced before 1960 which are consistent with the borders as delimited by the 1897 treaty.
Delimiting borders of Somaliland
Great Britain reached an agreement with France on the boundary between the respective territories they controlled on 2–9 February 1888. In order to determine the alignment of the British Somaliland–French Somaliland boundary, it was necessary to establish the exact starting point of the boundary on the Gulf of Aden. According to the Anglo–French agreement of 1888, the boundary began opposite the ‘wells of Hadou, but these wells could not be located, so shortly after the agreement, British and French Government officials agreed that the northern point of the boundary was a short distance northeast of Loyada on the Gulf of Aden (approximately 11º 27′ 55″ N., 43º 15′ 45″ E.) . The tripoint as to where these two boundaries would meet the Ethiopian boundary was decided in the 1930s on the basis of references to all the boundary agreements between the three countries. [See details in Jama Musse Jama (Ed.), “Time-‐line history of Somaliland”, 2017]
The Eastern Boundary of Somaliland was defined in the Anglo-‐Italian Protocol of 5 May 1894. It started at the intersection of the 8th Parallel North and Longitude 48 East, then moving diagonally northeast to the cross section of the 9th Parallel North and Longitude 49 East whereupon it follows that longitude straight to the Gulf of Aden. Here is how the Treaty described it: ‘On reaching the 8th degree of north latitude the line follows that parallel as far as its intersection with the 48th degree of longitude east of Greenwich. It then runs to the intersection of the 9th degree of north latitude with the 49th degree of longitude east of Greenwich, and follows that meridian of longitude to the sea’ (British Parliamentary Paper, Treaty Series No 1, 1894). Although the boundary between Ethiopia and Italian Somaliland has been in dispute, the tri-‐point between the three states at the intersection of 8° North, 48° East has not itself been the subject of any dispute. For further details, see details in Jama Musse Jama (Ed.), “Time-‐line history of Somaliland”, 2017.
New Measurements – Somaliland coastal line
Coastal line: This paper measured through google map with a scale of 50KM and found as 796.12KM without considering Sa’ad ad-‐Din islands. The frontiers between Somaliland and Ethiopia, between Somaliland and Djibouti, and between Somaliland and Somalia, is delimited by the Treaty (1897).
New Measurements – Somaliland area
Area: This paper measured through google map with a scale of 50KM and found as 169,226.89KM2 (65,338.87 square miles) without considering Sa’ad ad-‐Din islands.
Fun facts
- The oldest known world map dates back to the Babylonian Empire in 600 BCE, found in the late 19th century on the banks of the Euphrates River in present-day Sippar, Iraq. Etched onto a clay tablet, it depicts Babylon in the center of a landmass encircled by the sea, and includes the cities of Assyria and Elam, the Euphrates River, and the Zagros Mountains. It also labels swamps, canals, and outlying islands. The map is accompanied by Cuneiform text describing mythological beasts from the Babylonian Epic of Creation.
- Starting in the 4th century BCE, successive Chinese dynasties developed a thriving mapmaking tradition through the first millennium CE, boasting the first known economic map and precise depictions of vast territories.
o During Qin rule in the 3rd century BCE, the ceremonial annexation of territory included the presentation of a map of the land to the state ruler. A representative of Yan Dan concealed a dagger in the map presented to Qin, but failed in his assassination attempt.
- The Greek philosopher and scientist Aristotle is credited with proving that the Earth is a sphere in the 4th century BCE, while Eratosthenes made the first accurate estimate of the Earth’s circumference in the next century, and Ptolemy developed a coordinate system of mapping in the 2nd century CE.
- Medieval Muslim scholars built upon the Greek tradition of mapmaking with information from travelers, particularly during the Abbasid caliphate of al- Ma’mun, who commissioned a large world map in the 9th century CE. The Balkhi school in Baghdad trained geographers who produced extensive world atlases.
o Muslim geographers who improved upon Ptolemy’s calculations included Muhammad ibn Musa al-Khwarizmi, who compiled the coordinates of over 2400 locations in the Kitab surat al-Ard, or Book of the Shape of the Earth, in 833.
- Coastline paradox: when the scale of the map increases, the length of coast increases..
By Jama Musse Jama